10 - use case: recent time series
download & read data
## rdwd::updateRdwd()
library(rdwd)
link <- selectDWD("Potsdam", res="daily", var="kl", per="recent")
clim <- dataDWD(link, force=NA, varnames=TRUE)
str(clim)
## 'data.frame': 550 obs. of 19 variables:
## $ STATIONS_ID : int 3987 3987 3987 3987 3987 3987 3987 3987 3987 3987 ...
## $ MESS_DATUM : Date, format: "2024-09-25" "2024-09-26" ...
## $ QN_3 : int 10 10 10 10 10 10 10 10 10 10 ...
## $ FX.Windspitze : num 12.4 16 18.6 18 8.4 14.9 10.4 7.8 10.4 9.2 ...
## $ FM.Windgeschwindigkeit : num 4.5 5.9 7.2 6.7 3.5 4.7 4.6 3.4 3.7 3.4 ...
## $ QN_4 : int 9 9 9 9 9 9 9 9 9 9 ...
## $ RSK.Niederschlagshoehe : num 6.7 1.5 0.2 0 0 0.5 10.5 4.3 0.1 1.4 ...
## $ RSKF.Niederschlagsform : int 6 6 6 6 0 6 6 6 6 6 ...
## $ SDK.Sonnenscheindauer : num 0.4 0 6.6 7.9 8.6 10.2 0 0 0 0.6 ...
## $ SHK_TAG.Schneehoehe : int 0 0 0 0 0 0 0 0 0 0 ...
## $ NM.Bedeckungsgrad : num 7.3 7.9 4.6 3.5 2.3 4.6 8 7.9 7.8 6.8 ...
## $ VPM.Dampfdruck : num 14.7 15.3 12.2 10 8.7 8.2 10.9 11.3 11.7 11.5 ...
## $ PM.Luftdruck : num 994 984 987 1002 1015 ...
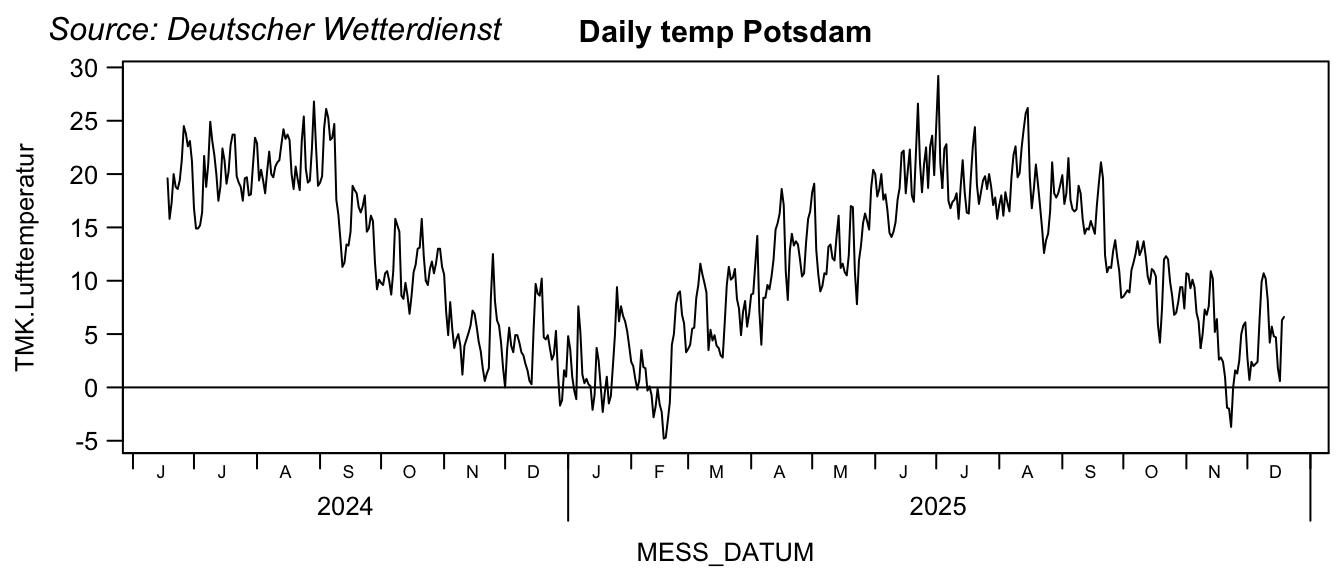
## $ TMK.Lufttemperatur : num 14.9 16.1 15.6 11.7 9.2 10.1 9.8 9.6 10.7 10.9 ...
## $ UPM.Relative_Feuchte : num 87 83 69 73 76 69 89 95 90 88 ...
## $ TXK.Lufttemperatur_Max : num 18.5 18.8 20 16 15.7 16.1 12.1 10.2 12.6 15.2 ...
## $ TNK.Lufttemperatur_Min : num 12.1 13.2 11.8 6.7 5.6 4.8 7.9 8.9 9.1 7.3 ...
## $ TGK.Lufttemperatur_5cm_min: num 9.8 12.2 10.6 3.9 2.2 1.5 7.5 8.9 8.7 4.4 ...
## $ eor : Factor w/ 1 level "eor": 1 1 1 1 1 1 1 1 1 1 ...plot time series
par(mar=c(4,4,2,0.5), mgp=c(2.7, 0.8, 0), cex=0.8)
plot(clim[,c(2,14)], type="l", xaxt="n", las=1, main="Daily temp Potsdam")
berryFunctions::monthAxis()   ;   abline(h=0)
mtext("Source: Deutscher Wetterdienst", adj=-0.1, line=0.5, font=3)